

Anatoliy Dankov
CTO
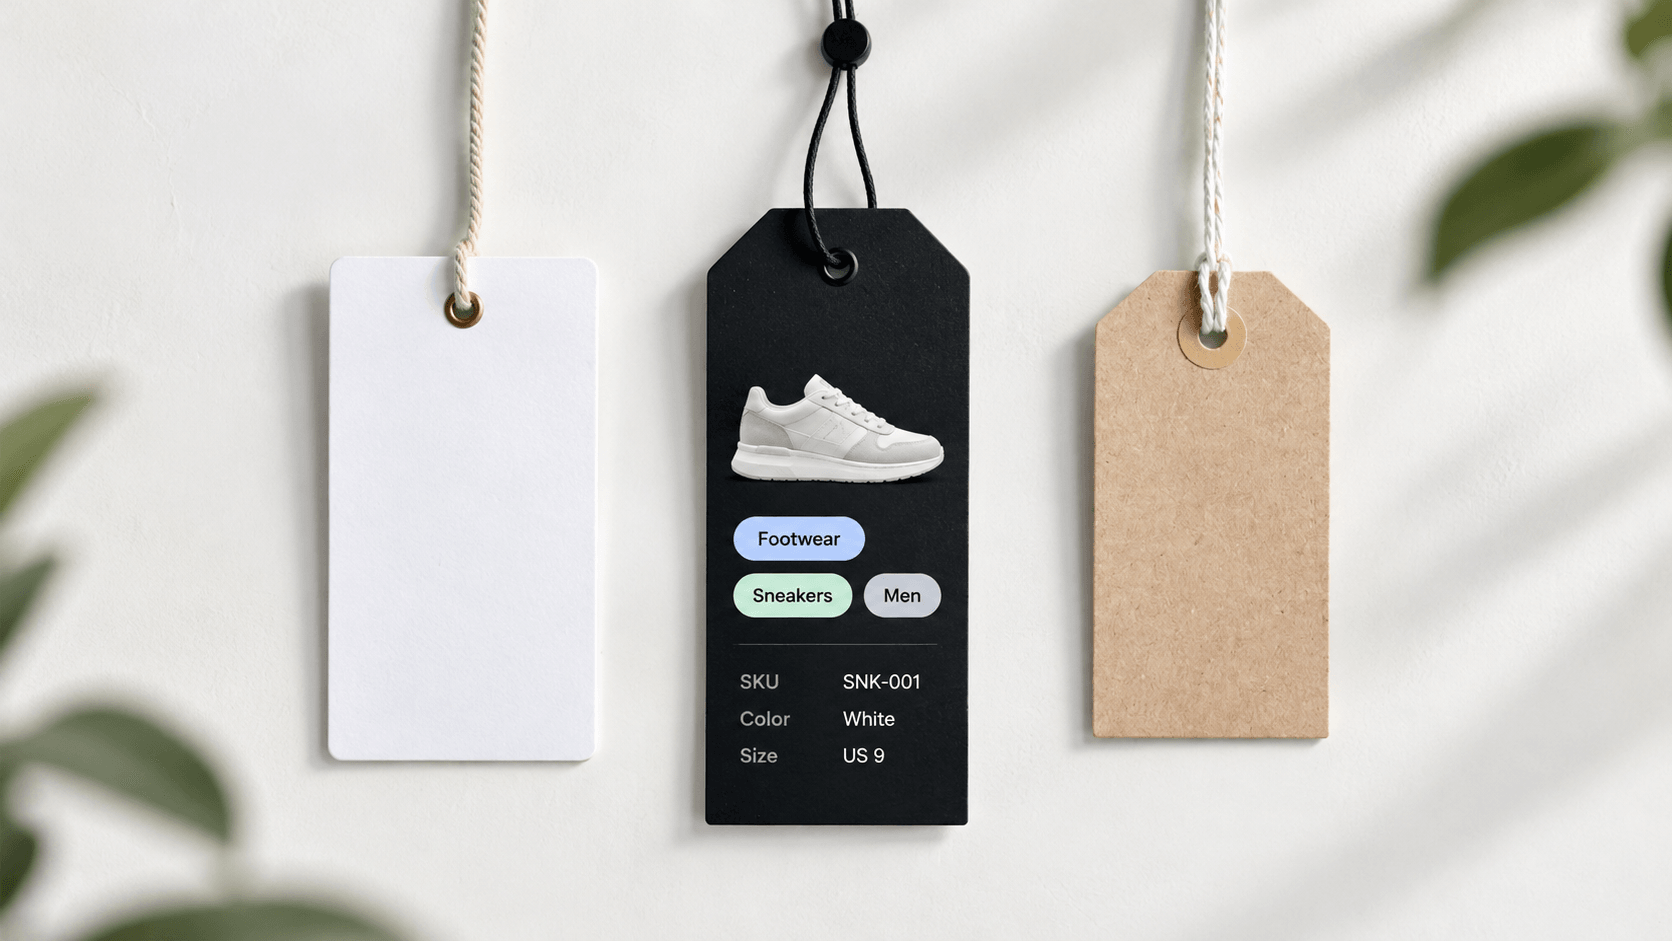
Automated product tagging helps ecommerce teams solve one of the most persistent catalog problems: product details that are missing or recorded differently by each supplier. Material, size range, color family, or compatibility arrive described in different words or not at all, and products with those gaps drop out of filtered results the moment a shopper narrows the search.
Fixing each product by hand turns into repetitive work that grows with every new supplier delivery.
This guide explains how automated product tagging works and how AI product data enrichment, such as , supplies the verified attributes that consistent tags are built on. It walks through the steps from source data to catalog tags, shows two practical examples, and covers the quality checks and software criteria that matter when you choose a solution for your catalog.
Automated product tagging is the process of assigning descriptive labels to products using software rather than adding each label by hand. The software draws on existing attributes, product titles, descriptions, supplier specifications, and, in some tools, images to identify relevant tags. Once connected to the store's merchandising and search systems, those tags support collections, on-site search, and filters.
Tagging works alongside attribute extraction and product categorization. The three tasks are closely related, but each produces a different type of catalog data:
Data type | What it does | Example |
|---|---|---|
Attribute | Stores a named product property and its value | Material: cotton |
Tag | Adds a descriptive label that groups products across categories | short sleeve |
Category | Places a product within the catalog hierarchy | Apparel > Women > T-shirts |
An attribute value can also serve as a tag. A retailer may use cotton both as a material value and as the label for a collection of cotton basics.
Automated tagging relies on predefined rules, AI models, or a combination of both. Rules assign tags from approved attribute values, and AI interprets the varied language suppliers use before mapping it to a consistent vocabulary. Neither method should turn incomplete information into unsupported claims, and a description that mentions only metal does not establish that the material is stainless steel.
Manual and automated product tagging differ mainly in where the catalog team spends its time. With manual tagging, specialists read every supplier file and enter values manually, which works for a small catalog but slows as the number of suppliers and SKUs grows. With automated tagging, the software proposes values and the same specialists review the uncertain ones, which ties the workload to the quality of incoming data rather than to the size of the catalog.
In this guide, automatic product tagging and automated product tagging refer to the same process. What separates one tool from another is how it produces, checks, and maintains tags, and whether the result fits your catalog structure.
AI product tagging combines data collection, attribute extraction, classification, normalization, and tag assignment, and more advanced tools add confidence scores and source references. Knowing these steps helps a catalog team see where errors enter the process and what to check before publication.
[Diagram: source data → attribute extraction → taxonomy classification → value normalization → tag assignment → confidence scoring → review and publication]
Input Collection
The process starts with the product information already available: supplier titles and descriptions, specification sheets, existing attributes, and category assignments. Some tools also read product images and manufacturer pages.
Every source has to describe the correct product and variant, because a detailed specification for a similar model introduces more errors than a short but accurate supplier record.
Product Attribute Extraction
The system identifies candidate values for fields such as material, dimensions, color, or power. Text-based extraction retrieves specifications from descriptions and documents, and tools with image analysis add visible features like patterns or neckline shapes.
When information is missing, AI product data enrichment can obtain additional attributes from verified sources, as described in our guide to ecommerce product data enrichment services. Properties such as material composition or device compatibility should never be inferred from appearance alone.
Taxonomy Classification
When classification is part of the workflow, the system maps each product to a category in the catalog taxonomy, and that category determines which attributes apply. Sandals require heel height and strap type, whereas monitors require screen size and resolution.
Classification and extraction check each other. Existing category assignments guide extraction, and extracted attributes show whether the assigned category is correct.
Value Normalization
Extracted values are mapped to the catalog's agreed vocabulary and formats, for example by converting inox and stainless steel into the same approved material value.
Colors call for a more careful approach, and a retailer may group navy and midnight under the filter family blue and keep the original shade in a separate field. Good normalization simplifies navigation without erasing meaningful product differences.
Tag Assignment
The system then uses approved attributes and catalog rules to assign tags, and a verified material value of cotton, for example, produces a cotton tag.
Not every field deserves a separate tag, because numeric measurements usually work better as structured attributes for filters and descriptive labels are more useful for organizing collections. A store that already filters directly by attributes gains little from duplicating each value as a tag, which is why every tag should serve a defined purpose in the store.
Confidence Scores and Source Attribution
Confidence scores help prioritize uncertain results for review, and source references show a reviewer exactly where each value came from.
Neither signal guarantees accuracy on its own. A high-confidence value can still belong to the wrong variant, and conflicting sources call for investigation rather than a vote between them.
Review, Approval, and Publication
The catalog team defines which results go to review and who approves them, and routing rules send uncertain values to the right reviewer. Attributes that affect compliance, safety, or returns deserve a check regardless of their confidence score.
After publication, test the result in the storefront to confirm that tags and attributes place products in the intended collections and filtered results, and that updates do not leave outdated labels behind.
 Product Taxonomy and Tag Consistency
Automated product tagging depends on a consistent catalog structure. Without one, the same supplier description produces different labels across products, and shoppers end up with duplicate filters and incomplete collections.
A product taxonomy organizes products into categories and subcategories, and each category carries a defined set of attributes: monitors require screen size and refresh rate, and chairs require dimensions and material. Tags add groupings that cut across this structure, such as height adjustable or set of 2.
Before processing supplier data, define three things:
Suppliers might describe a monitor stand as height adjustable, adjustable height, or height adjustment supported, and all three can map to the same attribute value and, where useful, to the tag height adjustable. A description that mentions only an adjustable stand requires clarification, because the adjustment could refer to tilt rather than height.
Normalization and interpretation are different operations and should stay separate. Converting equivalent units or mapping agreed synonyms makes data consistent, whereas turning an oak finish into oak as the frame material changes the meaning of the record.
A product information management system gives the team one place to maintain category structures and attribute definitions. A tagging workflow connected to it applies the same rules to new supplier data as to the existing catalog.
Product Tagging Examples by CategoryThe two examples below show what automated product tagging produces from typical supplier input for furniture and electronics. Confidence scores are illustrative, and the review threshold in both cases is 0.85, which means any value below it goes to a catalog specialist before publication.
Furniture: Dining Chair
Supplier input, a row from an Excel spec sheet:
Chair Oslo oak/grey fabric, 45x52x82, set of 2, KD
Attribute | Value | Confidence | Source | Status |
|---|---|---|---|---|
Category | Furniture > Dining Room > Dining Chairs | 0.94 | Title, image | Approved |
Frame material | Oak | 0.80 | Title | Review |
Upholstery material | Fabric | 0.94 | Title | Approved |
Upholstery color | Grey | 0.95 | Title, image | Approved |
Dimensions (W × D × H) | 45 × 52 × 82 cm | 0.78 | Title | Review |
Pack quantity | 2 | 0.97 | Title | Approved |
Assembly | Required | 0.84 | Title | Review |
Style tag | Scandinavian | 0.72 | Image | Review |
Three values fall below the threshold for clear reasons. The title does not say whether oak refers to solid wood, veneer, or a finish, the dimensions come without units or an order of measurement, and assembly is inferred from KD, a supplier abbreviation for knock-down furniture.
Suggested tag: set of 2, for retailers that group products by pack quantity.
Withheld tags: solid oak, oak frame, assembly required, and Scandinavian, until the open values are confirmed.
Catalog use: the confirmed pack quantity supports a collection or filter, and the frame material, dimensions, and assembly values stay unresolved rather than becoming precise-looking labels.
Supplier input, a short product description:
27-inch QHD IPS display 165Hz, 1ms, HDMI 2.0 x2, DP 1.4, height adjustable stand, VESA
Attribute | Value | Confidence | Source | Status |
|---|---|---|---|---|
Category | Electronics > Computer Monitors | 0.99 | Description | Approved |
Screen size | 27 in (68.6 cm) | 0.99 | Description | Approved |
Resolution | 2560 × 1440 (QHD) | 0.95 | Description | Approved |
Panel type | IPS | 0.98 | Description | Approved |
Refresh rate | 165 Hz | 0.99 | Description | Approved |
Response time | 1 ms | 0.97 | Description | Approved |
HDMI inputs | 2 × HDMI 2.0 | 0.97 | Description | Approved |
DisplayPort | DisplayPort 1.4, quantity not stated | 0.80 | Description | Review |
Stand adjustment | Height | 0.94 | Description | Approved |
VESA mounting | Supported, pattern not stated | 0.70 | Description | Review |
Suggested tags: IPS, 165 Hz, height adjustable.
Withheld values: the DisplayPort count and the VESA mounting pattern, until the manufacturer specification confirms them.
Catalog use: verified display specifications support product comparison and filtering. In a store that filters directly by these attributes, tags are created only for the labels used in collections
What the Examples ShowReliable automated tagging separates what the supplier states from what still requires verification. It keeps the source of every value, normalizes values according to agreed catalog rules, and creates tags only from supported attributes.
Open values stay visible to the catalog team as a clear review task, which is far safer than an assumption that places a product in the wrong collection. For a step-by-step review process, see our guide on how to validate AI-generated product attributes before publishing.
Automated product tagging produces stable results when the workflow around the tool is designed as carefully as the tool is chosen. The practices below cover two areas: deciding in advance which values can be trusted automatically, and checking the output against measurable criteria instead of occasional spot reviews.
Best Practices for Automated Product TaggingQuality Checks Before and After Publishing
Before publication, automated checks catch the errors that do not depend on interpretation:
After publication, a small set of metrics shows whether tagging quality holds over time:
Tracking acceptance and correction rates also shows when a threshold can be relaxed, since an attribute with consistently high acceptance can move to automatic approval without added risk.
Most automated product tagging software produces convincing results in a demo, because demos run on clean sample data. The differences between tools appear on your own catalog, with your suppliers' abbreviations, your taxonomy, and your review process. The criteria below separate tools that only generate tags from tools a catalog team can rely on.
Criterion | What to check |
|---|---|
Confidence scoring | Whether every value comes with a score, and whether thresholds can be set per attribute rather than for the whole catalog |
Source attribution | Whether the tool records if a value came from the title, description, spec sheet, or image |
Taxonomy fit | Whether tagging follows your category tree and attribute sets, or forces you into the vendor's own structure |
Value normalization | Whether output is mapped to your controlled value lists, units, and size systems |
Input coverage | Whether the tool reads images, PDF spec sheets, and supplier Excel files along with product text |
Review workflow | Whether low-confidence values are routed to the right specialist automatically, and whether routing rules can be changed without developers |
Data location | Whether tagged values land in the system where product data is managed, or arrive as a file the team has to import |
Pricing mode | How cost scales with catalog size, and whether re-tagging after taxonomy changes is charged again |
Pilot Testing on Your Own DataA pilot on a few hundred real products from one or two categories is the most reliable way to compare vendors. Give each vendor the same set, including difficult items from suppliers with poor data, and compare the results with the specialist-tagged baseline described in the best practices above.
Acceptance rate, the share of empty fields, and the number of confident but wrong values reveal more than any feature list.
Standalone Tool or Part of a PIMStandalone tagging tools are quick to start with, but their output has to be exported and imported into the system that holds product data, and every round trip creates a chance for values to drift. Tagging inside a PIM keeps values, history, and approvals in one place, although a full PIM implementation is often more than a team wants at the start.
The deciding factor is whether a tool lets you begin with tagging alone and expand later without migrating your data. For a broader comparison of vendors, see our review of the best AI product data enrichment tools.
The service was designed around the evaluation criteria described above. Each value that AI Enrichment extracts comes with a confidence score and a reference to the source it was taken from, which gives reviewers a clear basis for every decision.
Tagging follows the client's own category tree, attribute sets, and value lists through a flexible data model. Thresholds for automatic approval are set by the catalog team in the Rule Engine without code, and values below them go straight to the right specialist for review.
Pricing is credit-based, with one credit covering one enriched SKU, and the cost stays predictable for a pilot on a single category as well as for a catalog of several hundred thousand products. Teams can begin with enrichment alone and move to the full HootCore PIM later without migrating their product data.
To see automated product tagging on your own catalog, book a demo and our team will walk you through confidence scores, review rules, and tagging results on products from your categories.
The most visible benefit is product findability. When attributes are filled and normalized across suppliers, products appear in the filters and on-site search results shoppers rely on, and the catalog stops losing sales to empty fields.
Automated tagging also shortens the time between receiving supplier data and publishing a product. An electronics retailer using HootCore cut product card creation from 25 to 9 minutes, and the catalog team spent the saved time on review rather than data entry.
The third benefit shows up outside the store, where consistent attributes improve acceptance in marketplace feeds and give AI shopping assistants the structured data they use when deciding which products to recommend.
Accuracy depends more on the input data and the type of attribute than on the model itself. Values stated directly in a supplier specification are extracted with high reliability, whereas values inferred from images or vague descriptions carry more risk.
For that reason, acceptance rate per attribute on your own products is a more useful measure than a single accuracy figure from a vendor, because it shows which fields can be published automatically and which should go to review.
Tagging runs without a PIM, and a standalone tool or enrichment service is a common starting point.
A PIM becomes valuable as the catalog grows, because category requirements, value lists, tagged values, and their approval history then live in the same system instead of traveling between files.

Talk to our team and see how HootCore fits into your existing stack, from product data management to order fulfillment.